Count the cost of both outcomes
A shop sells an $80 bag online and offers a prepaid return label. One buyer keeps it. Another sends it back. The same $80 sale appeared at checkout in both cases, but one order left the shop with revenue and the other could leave a refund, two shipping bills and time spent checking a bag that may no longer sell as new. To see whether the policy is affordable, compare the money left from both outcomes after the costs that vary with an order. That is a different question from whether customers read the policy or whether a return label is expensive on its own. [1] [2] [3]
Start by writing down what the shop promises and who pays for each leg. A promise of free returns often concerns the cost of sending the item back. The policy can also address the length of the return window, whether original shipping is refunded and what happens to an item that has been used. The FTC’s shopping guidance tells buyers to check shipping responsibility and restocking fees among other terms. Those terms matter to the shop’s ledger because a return involving a refund, a prepaid label and an opened product can produce a different result from a return at a counter in saleable condition. [1] [2] [3]
Follow one bag through the ledger
Suppose the bag costs the shop $32 and outbound shipping costs $7. Assume the shop covers that shipping and charges the buyer $80 total. For an order the customer keeps, $80 less those two costs leaves $41 before payment fees, rent, regular staff costs and other expenses. Now suppose the shop refunds the full $80, pays $6 for the return label and spends $4 on inspection and repacking. If the item goes back into stock in saleable condition at its original $32 inventory cost, the merchandise has been recovered in this simplified example. The returned order still leaves a $17 loss from shipping and handling. Treating a clean return as costless would miss that work and transport. [2] [3]
A returned bag with damage changes the result. Assume the shop can recover $10 of value after any disposal or resale costs instead of the original $32 cost. The $22 difference adds to the $17 shipping and handling cost, giving a $39 loss for the order in the model. The $10 is an estimate of value recovered from the item, so counting the full cost as a loss and then ignoring recovery would overstate the damage. Counting a resale payment as though it happened on the date of the first refund would also blur the timing. Record the condition and the actual recovery separately when you can. [2] [3] [4]
Compare a group of orders
Take 100 orders placed under the same policy. If 88 are kept, eight return in saleable condition and four lose most of their value, the kept orders contribute $3,608 in the example. The two return groups cost $136 and $156, leaving $3,316, or $33.16 per order placed before omitted costs. The return rate is 12 percent, but the group total depends on what came back. If all 12 returned bags could go back into stock at full inventory cost, the returns would cost $204 in total. The same 12 percent return rate would leave $3,404, or $34.04 per order placed. Track both how often orders come back and how much each outcome costs. [2] [3] [4]
Use a group of orders placed within the same period and give it time for the return window to pass. Pairing this month’s new orders with this month’s refunds can mix holiday purchases, older orders and sales made under different terms. If a dashboard counts one refund and one return label as two returned orders, reconcile it against unique order or item records. Decide whether your denominator is orders or units and write it down. A shopper who orders three sizes and returns two can be one returned order and two returned units. Both views can help as long as you compare like with like. [2] [3]
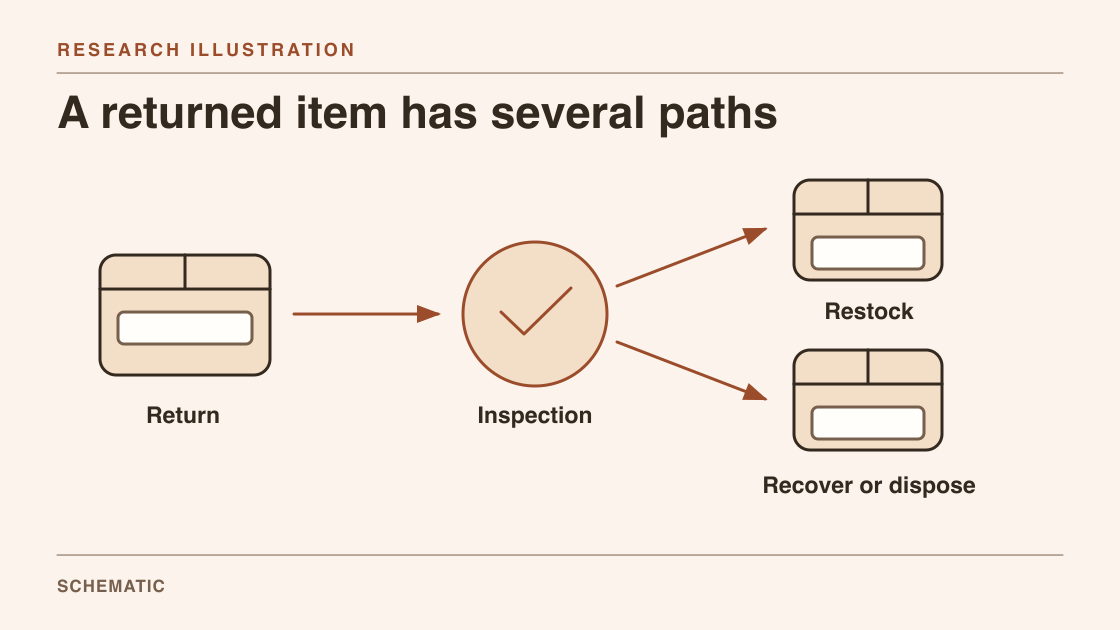
The path of an $80 order
- Customer keeps the bag
$80 sale less $32 product cost and $7 shipping leaves $41.
- Shop restocks the bag
A full refund, shipping and handling leave a $17 loss.
- Shop recovers only $10
The $22 inventory loss adds to shipping and handling for a $39 loss.
- Compare the order group
Weight the outcomes by how often each happens in the same sales group.
What happened when one retailer changed the policy
Researchers publishing in the Journal of Operations Management examined a Swedish online fashion retailer that waived return shipping charges for Danish customers on November 1, 2017, while leaving the policy unchanged in several other markets. They compared changes over time in Denmark with changes in those comparison markets using order records. Their estimates associated the policy with a 9.15 percent higher order bill and a 9.71 percent higher gross margin per order on the measures they used. Items returned per order also rose, by about 0.195 items. These are estimates for the retailer and intervention studied, in a category where shoppers may order different fits and styles. [4]
In the authors’ simplified calculation, the added cost of free returns exceeded the gain in gross profit from the policy. A larger basket and higher measured margin per order can therefore coexist with a weaker result after return costs. The study covers one retailer and estimates immediate costs. Any effect on longer-term retention remains uncertain. A small shop can borrow the questions from the study. What happened to order size, how much came back, and did the margin gain cover the extra handling and postage? [2] [4]
Make the condition of returned goods visible
For a small shop, recovery can be the least visible part of the calculation. An item may be ready to put back on the shelf, need an hour of repair, or have no practical resale outlet. Start with a few categories the team can use consistently and compare the actual proceeds with any estimate made at inspection. If an item sits for months before being resold, keep that delay visible instead of treating the recovered inventory value as immediate cash. If a marketplace or carrier reimburses a cost, put the reimbursement on its own line so the original cost and the eventual recovery can both be checked. [1] [2] [4]
Different return reasons can point to different problems. A wrong size may suggest a clearer size guide, while repeated damage may call for a packaging review. An item returned because it looked different from the listing may lead the shop to inspect its photos and description. In each case, check whether a change alters the relevant return reason as well as total order economics. A policy that saves the cost of labels can still lose money if it discourages enough otherwise profitable orders. Measure sales and returns together so the shop can see whether fewer returns came from fewer problems or simply from fewer purchases. [1] [2] [4]
Compare policies after the returns arrive
Before making a change, write a small comparison plan. Choose the product group, policy terms, period and measures in advance. Keep delivery promises, discounts and product mix as comparable as you can. Then follow each group until most eligible returns have been processed and compare net receipts, variable costs, recovery value and the amount left per order placed. Mark any unusually large damage claim or sales promotion so it does not look like a permanent change in the policy. A result can still be useful when the group is small if you describe it as a limited test and keep the assumptions visible. [1] [2] [3] [4]
Finally, keep the management calculation separate from the cash forecast. A refund may have to leave the shop before a returned item is inspected, repaired and sold again. A saleable bag can restore inventory value without providing the cash needed for a carrier invoice that week. The contribution calculation answers whether orders can cover variable costs and help pay fixed costs over time. The cash forecast answers when the money is available. A shop deciding between two return policies needs both views. Once you can see how much each outcome costs and when cash leaves, the policy becomes a decision you can revisit with evidence. [2] [3] [4]
Common questions
Is a refund the same as a return cost?
A refund reduces the money kept from the sale. Shipping, handling and any loss in the item’s resale value are separate effects in the shop’s calculation. [2] [3]
Can a lower return rate hide a worse result?
Yes. It may accompany a decline in orders or a higher loss on each return. Compare contribution for the same group of orders rather than the return rate alone. [2] [4]
Sources & further reading
- [1] FTC online shopping guide
Describes consumer-facing policy terms such as return shipping, restocking fees and deadlines.
- [2] SBA guide to break-even point
Explains the difference between selling price and variable costs and how fixed costs enter a break-even calculation.
- [3] IRS Publication 334 on returns and allowances
Distinguishes gross receipts, returns and allowances, and net receipts for the U.S. small businesses covered by the guide.
- [4] Patel and colleagues’ 2021 study of free return shipping
The authors’ accepted manuscript describes the Danish policy change, order-level estimates and the authors’ illustrative cost comparison.
Method & limitations
This article pairs U.S. guidance on retail terms and contribution margin with order-level research from an online fashion retailer. The small-shop ledger uses hypothetical U.S. dollars and is a management example, with assumptions stated where they matter.