Separate sales from the money still due
Imagine a workshop that supplies custom display stands. One retailer places a large order most months and keeps the machines busy. On the sales report, the relationship looks healthy. On a day when payroll is due, the owner asks how much of the cash expected that week depends on the retailer paying. The sales share measures how much of the workshop’s sales revenue came from that customer over a period. A receivables share tells you how much of the money outstanding on a particular date is owed by the customer. A business can have one large number, two large numbers or two quite different numbers. [1] [2]
Compute the sales share over a defined period by dividing the customer’s sales by the business’s total sales on the same basis. In a hypothetical shop with $600,000 of annual sales, $240,000 from one customer makes the share 40 percent. On a particular date the customer might owe $70,000 of the shop’s $100,000 in open trade invoices. The receivables share that day is 70 percent. The larger share does not imply that the customer missed a due date. It can reflect order timing or longer payment terms. Read the invoice dates before treating the balance as evidence that a payment is late. [1] [2]
Read the two numbers in a real filing
Credo Technology Group reported both types of concentration in its annual report for the fiscal year ended April 27, 2024. The company identified a party as Customer A and reported that it represented 39 percent of revenue for the fiscal year and 53 percent of total accounts receivable at the year-end date. The two percentages came from the same report, but one used a full year of revenue and the other used a balance on one day. The company was describing its own reporting period and customers. A small workshop can use the example to learn how to read the numbers without borrowing the percentages as targets. [2]
Repeat the receivables calculation over several closing dates before drawing conclusions from one balance. A large shipment late in the month can briefly lift the share even when the customer pays on time. A pattern of high balances or past-due invoices tells a different story. Look behind account names as well. If three invoices go to different branches but the same parent approves all purchases and settles all bills, the owner may have one practical source of revenue or cash even with three names in the accounting software. Decide how to group related customers and use that approach consistently when you compare months. [1] [2]
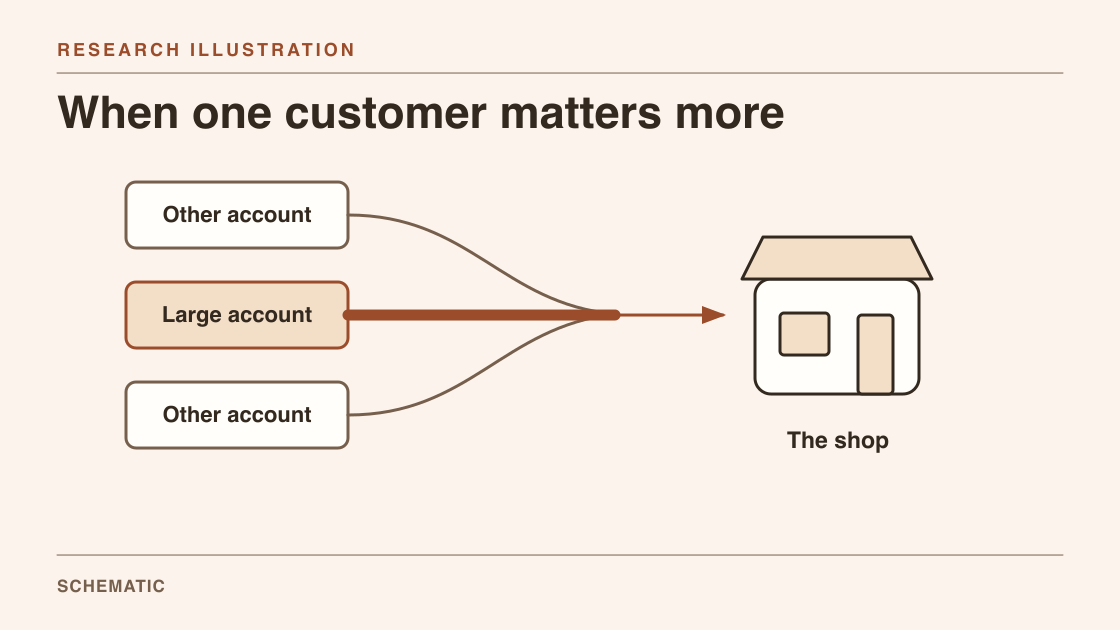
Two ways a large customer matters
- Measure annual sales
In the example, $240,000 of $600,000 in sales is 40 percent.
- Measure open invoices
On one date, $70,000 of $100,000 due is 70 percent.
- Test a payment delay
Move the expected receipt and check which bills come due first.
- Test a loss of orders
Subtract avoidable costs from lost sales to estimate lost contribution.
Test a late payment first
Start with the payment calendar. Suppose the shop expects $20,000 from its largest customer on Friday and has enough other cash to cover its obligations only if the payment arrives. Move that one receipt to the date it would reach the bank under a 30-day delay, leaving the orders and the original invoices in place. The shortfall appears on the calendar even though the customer has not cancelled work. Compare the gap with available cash and the bills that cannot move, then mark which other receipts are uncertain. This exercise can reveal a tight week that is invisible in the yearly sales share or average month. [1] [3] [5]
The Federal Reserve Banks’ 2025 report on employer firms found that, in its weighted 2024 survey results, 51 percent of small employer firms reported uneven cash flow among their financial challenges, and 56 percent reported difficulty paying operating expenses. The report includes collecting receivables among its examples of uneven cash flow. The survey drew on a nonrandom sample and used weights to reflect the population of small employer firms. Firms could report more than one challenge. The figures describe reported financial challenges across firms. The 2026 report uses a later survey and provides its own methodology. Check the questionnaire and definitions before treating percentages from different reports as a clean trend. [3] [5]
Test a loss of future orders separately
Now suppose the customer pays every open invoice but stops placing new orders. In this case, leave the expected collection of existing receivables in the cash calendar and remove the future sales. Work out which costs disappear and when. If a hypothetical customer brings in $10,000 a month of sales requiring $6,000 of materials, shipping and other costs that end with the orders, the relationship leaves $4,000 a month toward fixed costs and profit. Losing the work removes that $4,000 contribution in the example. The immediate effect is not the full $10,000 in sales because the shop also saves the costs it no longer incurs. [1] [2] [4]
The calculation becomes more difficult when a cost is committed. The workshop may be able to cancel future material purchases quickly but still owe rent, payments on a machine or minimum hours on a labor agreement. If some costs cannot be cut for three months, count them during that period because the related spending continues until the commitment ends. Also estimate how long it would take to win, make and collect on replacement orders. A new customer who places an order in the first month might not pay until the third. That timing gap can matter even if replacement work ultimately earns the same margin. [1] [4]
Look for ways the dependence can change
A large customer can make it worthwhile to invest in faster production or reduce the time spent finding sales. The risk becomes clearer when the shop asks what it commits to serve that customer. If it buys machinery usable by several customers, the idle capacity may be easier to redeploy. If it builds dedicated tooling, holds custom materials and accepts long payment terms, a smaller sales share can still pose a large problem. Track the share alongside contract dates, order frequency and any spending the shop has already promised. A simple ratio can point you toward the questions that need a closer look. [1] [2] [4]
When the relationship is important, changes can be gradual. The shop can seek orders that use the same equipment without requiring identical selling seasons, or it can try to bring forward the date on which it recovers material costs for unusually large jobs. The available options depend on the agreement and customers’ willingness to accept them. The point of the exercise is to compare effects. Shorter payment timing may improve the cash scenario without reducing the share of sales from the customer. A broader order book may reduce reliance on future work while the existing backlog of unpaid invoices still takes time to clear. [1] [2] [3]
Build a review that takes one page
A useful monthly page can hold the largest customer’s sales share, its share of open invoices, the past-due portion and a list of cash dates that depend on its payments. Add the customer’s estimated contribution after costs that can realistically be avoided, plus any commitments that would continue if orders fell away. Keep the late-payment and lost-orders scenarios in separate rows so the responses stay distinct. As the relationship changes, note what moved. A one-time shipment can raise receivables, a new price can change contribution, and a lower total from other customers can raise the sales share even when the largest customer’s purchases are flat. [1] [2] [3] [4]
Avoid assigning a universal alarm level to the percentage. A workshop with a dependable long-term contract, short collection terms and equipment that can serve several clients can experience the same sales share differently from a business with cancellable orders, custom stock and little cash. The comparison that matters is the one the owner can explain from the calendar and the cost ledger. Review what would happen under a delayed receipt and under a sustained loss of work. If each produces a different problem, the owner now knows which financial lever is relevant and which earlier warning would be worth checking each month. [1] [2] [4] [5]
Common questions
How do I calculate a customer’s share of sales?
Divide sales to the customer by total sales over the same period and on the same basis. If several accounts share a buyer, decide whether to group them consistently. [1] [2]
Can the receivables share exceed the sales share?
Yes. Sales cover a period while receivables are a snapshot. Shipment timing, larger invoices and different payment terms can leave a bigger balance on a particular date. [1] [2]
Sources & further reading
- [1] SBA guide to managing finances
Describes tracking revenue, costs, receivables and cash using different financial records.
- [2] Credo Technology Group fiscal 2024 Form 10-K
Note 3 reports annual revenue and fiscal year-end receivable shares for significant customers.
- [3] Federal Reserve Banks’ 2025 report on employer firms
Reports weighted responses from the 2024 Small Business Credit Survey, including operating expense and uneven cash flow challenges.
- [4] SBA guide to break-even point
Explains the price-minus-variable-cost calculation and the difference between variable and fixed costs.
- [5] Federal Reserve Banks’ 2026 report on employer firms
Describes the 2025 survey’s findings and points readers to methodology and definitions for employer firms.
Method & limitations
This analysis uses dated company disclosures, a Federal Reserve small business survey and U.S. Small Business Administration guidance. The shop examples are hypothetical. The disclosed percentages illustrate how the measures differ, without setting a benchmark for small firms.